
Figure 9.
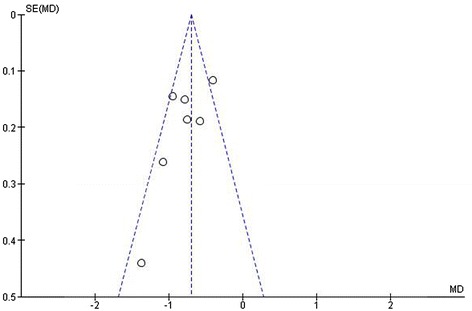
Funnel plot LBMD (Z-score) in patients with PKU. (SE = standard error; MD = mean difference) (Egger’s test: p = 0.407).
Official websites use .gov
A
.gov website belongs to an official
government organization in the United States.
Secure .gov websites use HTTPS
A lock (
) or https:// means you've safely
connected to the .gov website. Share sensitive
information only on official, secure websites.
Funnel plot LBMD (Z-score) in patients with PKU. (SE = standard error; MD = mean difference) (Egger’s test: p = 0.407).