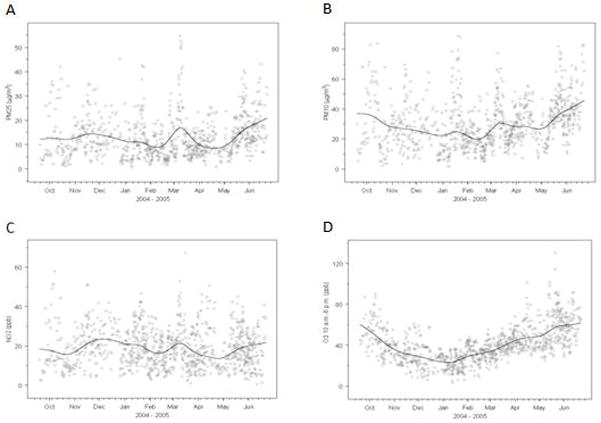
Figure 1.

The time trends of daily 24-hr average levels of PM2.5 (A), PM10 (B), and NO2 (C) and daily 10AM–6PM average levels of O3 (D) during the study period (September 19, 2004 – June 22, 2005). The superimposed smooth plot depicts the overall temporal trend and is based on a smooth spline function with 10 degrees of freedom.
