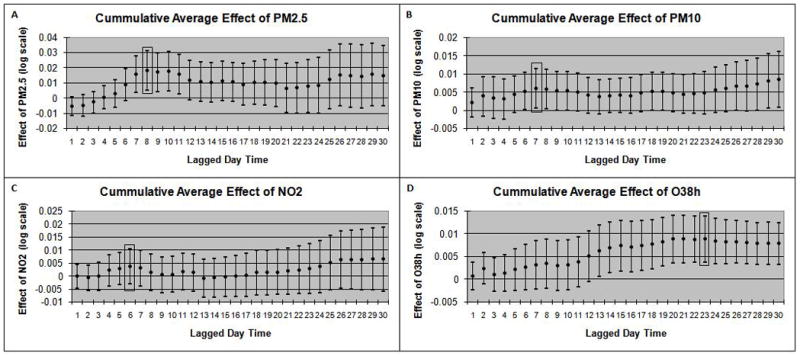
Figure 2.

Lag structure over a 30 day period of the cumulative averaged air pollution effects from fully adjusted multiple linear regression models for daily 24-hr average levels of PM2.5 (A), PM10 (B), and NO2 (C) and daily 10AM–6PM average levels of O3 (D). The Y-axis represents the adjusted effect estimate of each pollutant on natural log transformed FeNO. The best lag for each pollutant, selected via AIC, is indicated by a shaded rectangular box on each panel.
