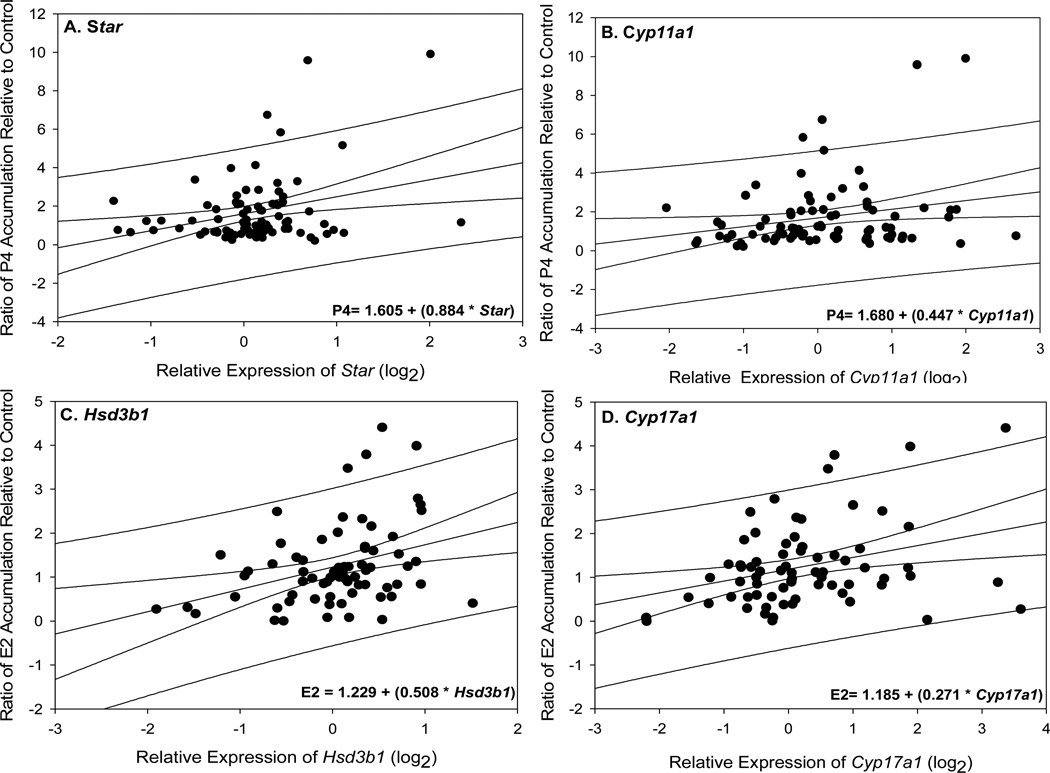
Figure 4.
(A–B) Effect of GNPs on ovarian progesterone (P4) and Star or Cyp11a1 expression. Regression analyses indicated that positive relationships existed between ex-vivo accumulations of P4 and the relative expression of (A) Star (df= 82 rats, p= 0.006, r2= 0.0891, adj r2= 0.0779) or (B) Cyp11a1 (df= 82, p= 0.032, r2= 0.0554, adj r2= 0.0437),) upon exposure to GNPs. (C–D) Effect of GNPs on estradiol 17-β (E2) and Hsd3b1 or Cyp17a1 expression. Regression analyses indicated that positive relationships existed between ex-vivo accumulations of E2 and the relative expression of (C) Hsd3b1 (df= 69 rats, p= 0.003, r2= 0.120, adj r2= 0.107) or (D) Cy17a1 (df= 69 rats, p= 0.006, r2= 0.1059, adj r2= 0.0922) upon exposure to GNPs. Data were pooled prior to statistical analysis; thus, factors of time and concentration were not considered.

