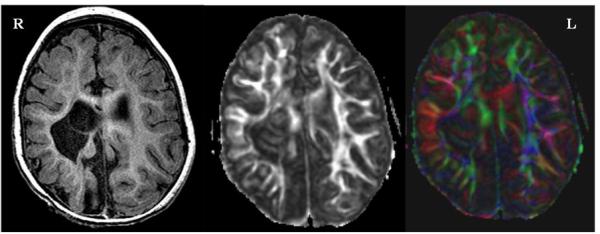
Figure 4.

An FSPGR T1-weighted anatomical image (left), gray-scale FA image (middle) and color-coded FA image ( right ) from a subject with hemiplegic cerebral palsy. This subject had a high FA asymmetry of 0.153 in the PLIC and 0.271 in the PTR. Note the remarkable disruption of corticospinal tracts at the level of the internal capsule on the right side of the brain.
