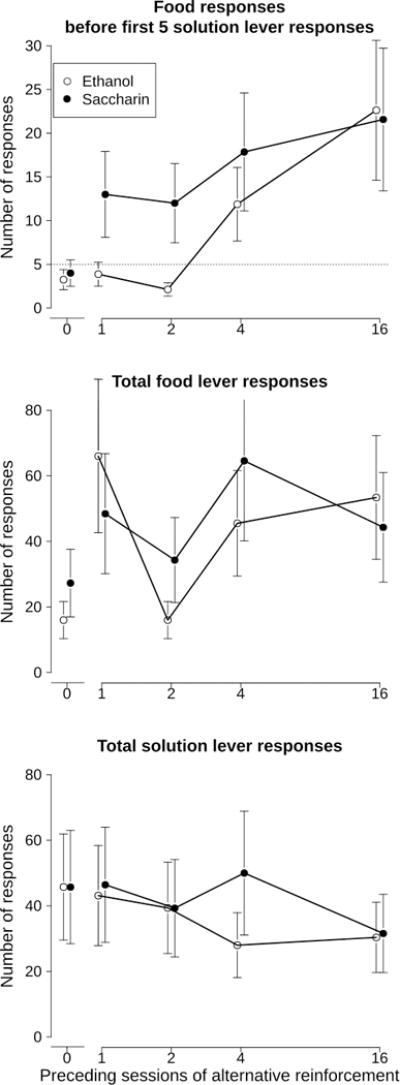
Figure 4.

Effects of varying the number of sessions during Phase III on food responses before the first 5 responses on the solution lever were completed during the test session (top panel); total number of food responses during the test session (middle panel), and total number of responses on the solution lever (bottom panel). The dotted line in the top panel represents 5 responses on the lever. Points above this line would have resulted in food delivery during Phase I, and represent more responding for food than for the solution prior to the first completion of the response requirement. Points represent mean ± S.E.M. For n=8 (ethanol, open symbols) or n=7 (saccharin, closed symbols) rats and have been offset for clarity. Note the abscissa is plotted on a log scale.
