
Figure 1.
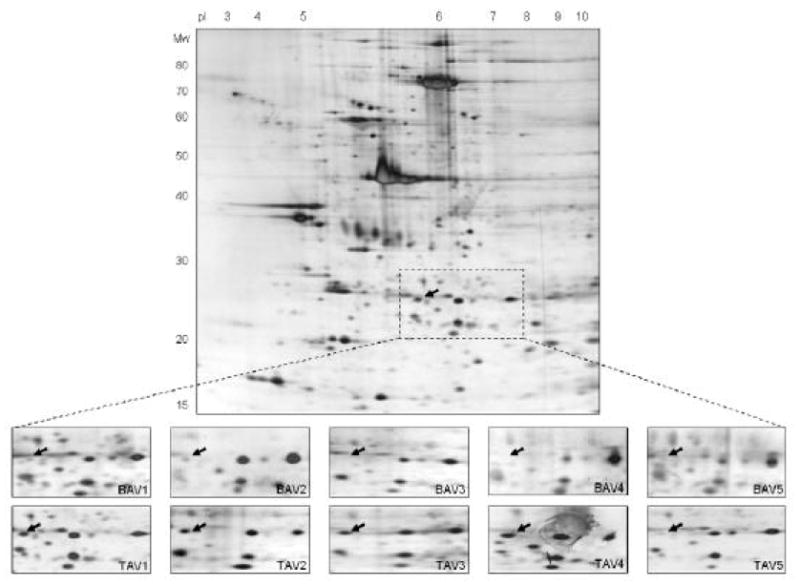
Representative 2-D gel (pH gradient 3-10, 11-19% SDS-PAGE) of an aortic aneurysm sample from a patient with a TAV. Magnified 2-D pattern of five BAV (A1-A5) and five TAV (B1-B5) are shown. The arrows mark the spot that is significantly lower expressed (=medium densitometric values) in BAV compared to TAV specimen (p=0.02). The protein spot was identified as HSP27 using MALDI-TOF mass spectrometry, and corresponds to number 2 in Figure 2 and 3.