
Figure 2.
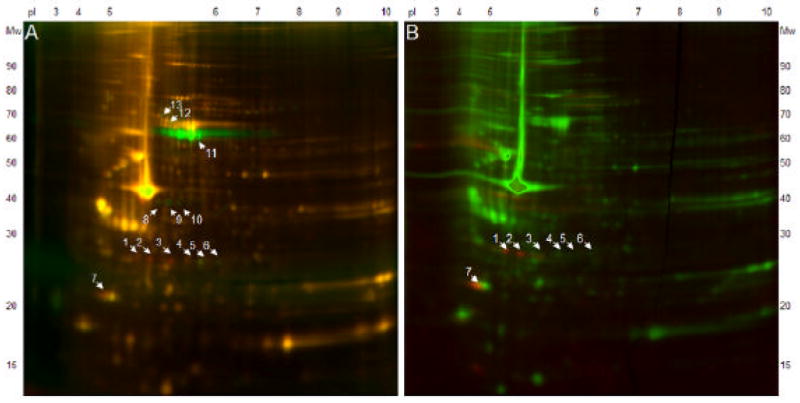
2-D DIGE (pH gradient 3-10, 10% SDS-PAGE) after Dephosphorylation (A) and Phosphostaining (B). Red spots represent phosphoproteins, green spots in Figure A represent dephosphorylated proteins, yellow spots in Figure A and green spots in Figure B represent non-phosphorylated proteins. The dephosphorylation experiment revealed 5 phosphorylated (spot 1 to 4, and 7) and 8 dephosphorylated (spot 5, 6, 8 to 13) protein spots, phosphostaining revealed 4 phosphoproteins (spot 1 to 3, and 7).