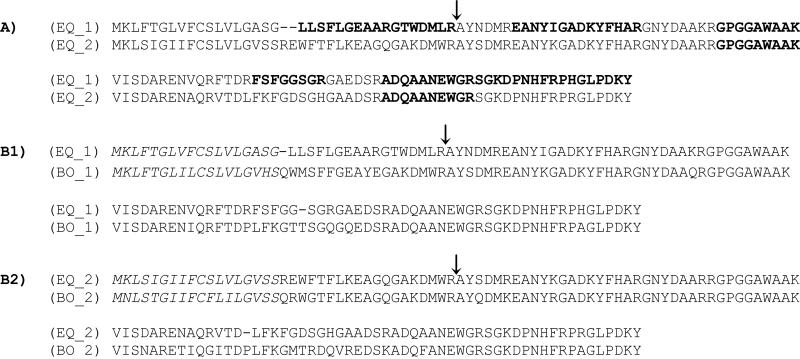
Figure 1.
A) Alignment of sequences assumed to represent two subgroups of equine SAA. EQ_1 represents SAA subgroup 1 (Q9N0Y1), EQ_2 represents SAA subgroup 2 (ENSECAP00000009324). The similarity of amino acids to the left of the arrow is 54%, compared to 88% for the rest of the sequences. Observed peptides are marked in bold. B1) Alignment of the equine SAA subgroup 1 with hepatically produced bovine SAA (BO_1) (P35541). The similarity of amino acids to the left of the arrow is 61%. B2) Alignment of the equine SAA subgroup 2 with extrahepatically produced bovine SAA (BO_2)(Q8SQ28). The similarity of amino acids to the left of the arrow is 81%. Signal peptides are marked in italic. For the horse they are presumed by comparison with bovine SAA. CLUSTAL 2.1 multiple sequence alignment (http://www.ebi.ac.uk/Tools/msa/clustalw2/) were used for alignment.

