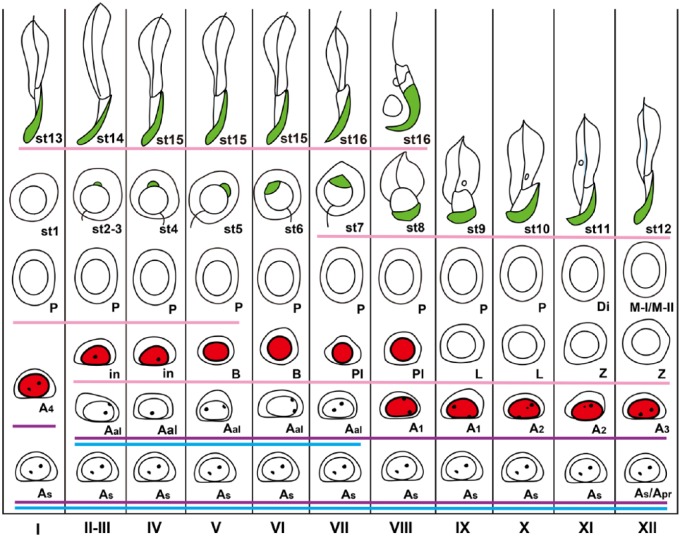
Figure 10.
Schematic figure showing the distribution of BrdU-labeled spermatogenic cells in the different stages of mouse spermatogenesis. With the present method, BrdU (red) was detected in the nuclei of A1 spermatogonia through to preleptotene spermatocytes. PNA (green) was detected in the acrosomes in spermiogenesis. GFRA1 was expressed in undifferentiated A spermatogonia (drawn with a light blue line), PLZF was expressed in undifferentiated and differentiated A spermatogonia (drawn with a purple line), and CADM1 was expressed in intermediate spermatogonia through to early pachytene spermatocytes and step 7 and later spermatids (drawn with a pink line). I–XII, stages of spermatogenesis; As: A single, Apr: A paired, Aal: A aligned, A1, A2, A3, A4: differentiated A spermatogonia; In: Intermediate spermatogonium; B: B spermatogonium; Pl: preleptotene spermatocyte; L: leptotene spermatocyte; Z: zygotene spermatocyte; P: pachytene spermatocyte; Di: diplotene spermatocyte; M-I/M-II: first and second meiotic divisions; st1-16: step 1-16 spermatids.

