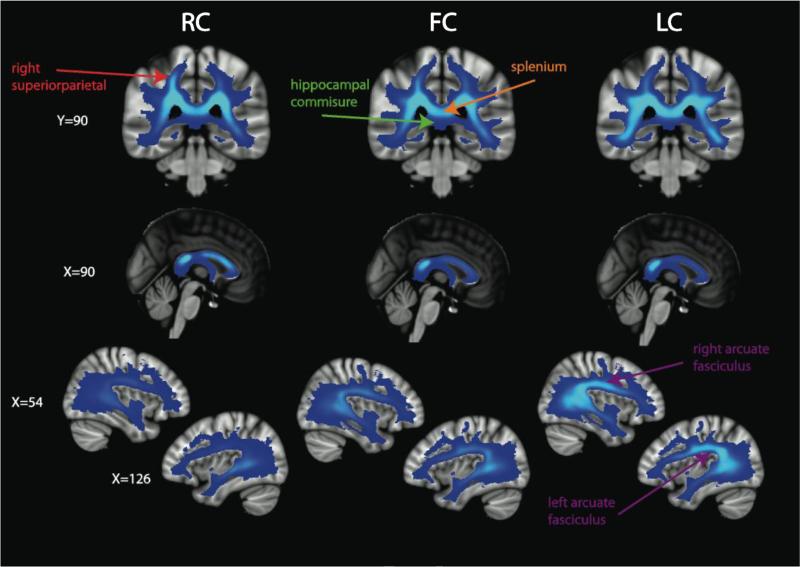
Figure 6.
Alternate views of the mean ED for the RC, FC, and LC. The color bar in Figure 5 applies to these images. A region of high ED for the RC in right superior parietal white matter is indicated with a red label, the splenium (with high RC, FC, and LC) and the hippocampal commissure (with low RC, FC, and LC) are is shown with orange and green labels, respectively, and the arcuate fasciculus, which is particularly high ED for LC, compared to RC or FC, is identified with purple labeling.

