
Figure 2. Color-coded matrices representing FC for the 9 main language connections.
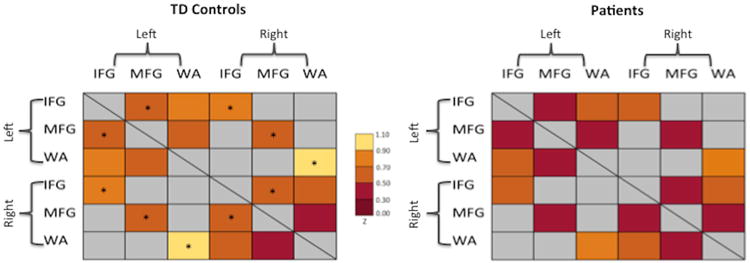
Matrices for TD Controls are displayed on the left panel and Patients with epilepsy on the right. The colors range from dark red (z=0.0-0.30) to yellow (z=0.90-1.10). * indicates language connections with a significant difference between groups. Connections that were not examined in the current study are identified by a gray color in the matrices.