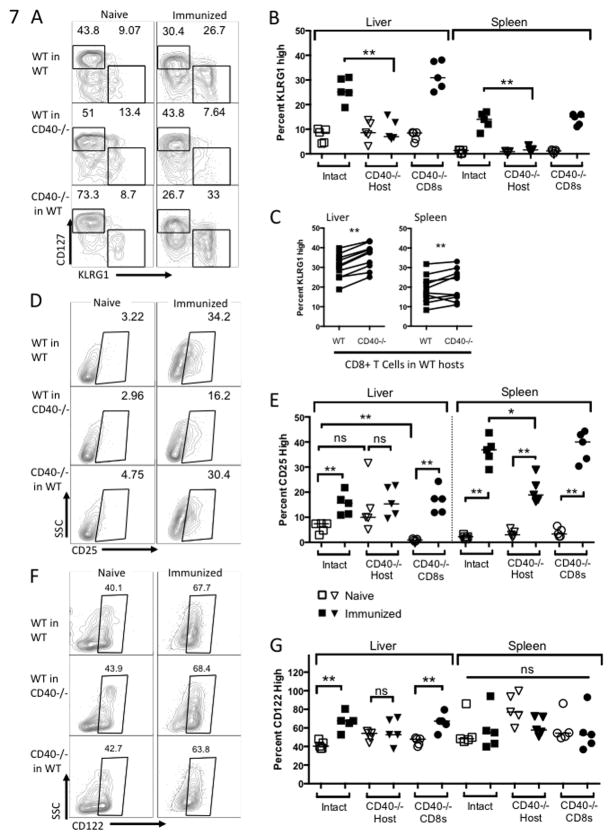
Figure 7. Host CD40 drives differentiation of effector cells.
Mice were treated as in Figure 5 and cells were collected on Day 5 post-immunization. (A) Representative plots of KLRG1 and CD127 expression on liver CD8+ T cells and (B) aggregate KLRG1 expression data from liver and spleen. Panel (B) compares WT CD8+ T cells in WT and CD40−/− hosts (Mann-Whitney test) and panel (C) compares WT and CD40−/− CD8+ T cells in WT hosts (Wilcoxon matched pairs test). (D) Representative plots of CD25 expression on splenic CD8+ T cells and (E) aggregate data from liver and spleen. (E) Representative plots of CD122 expression on liver CD8+ T cells and (F) aggregate data from liver and spleen.

