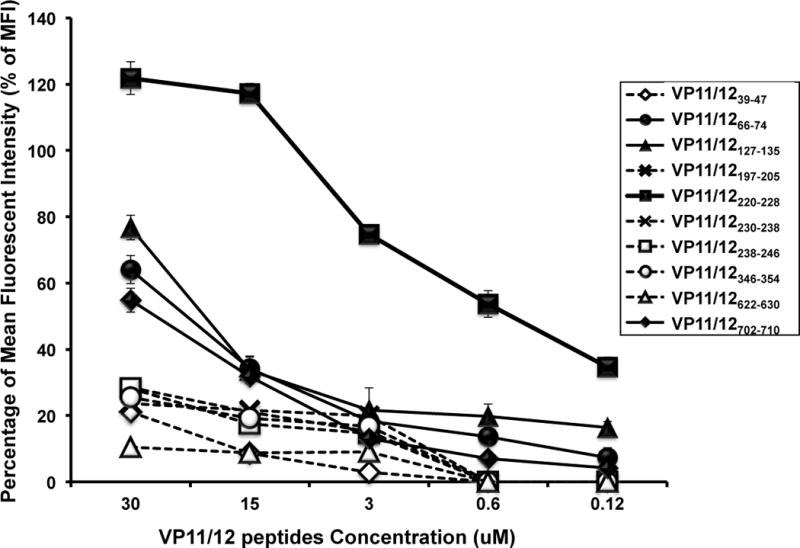
Figure 1. Stabilization of HLA-A*0201 molecules by VP11/12 peptides on the surface of T2 cells.

T2 cells (3 × 10⁵) were incubated with serial dilutions of the indicated VP11/12 peptide, as described in Materials & Methods. Cells were then stained with FITC conjugated anti-HLA-A2 mAb (BB7.2). The graph represents the percent of mean fluorescence intensity (MFI) reflecting an increase in the expression of HLA-A2 molecules on the surface of T2 cells triggered by various concentrations of VP11/12 peptides. The percent of MFI increase was calculated as follows: Percent of MFI increase = (MFI with the given peptide − MFI without peptide)/(MFI without peptide) × 100. Solid lines represent peptides that bind with high to moderate affinity to HLA-A02:01 molecules, as determined by stabilization of high levels of HLA-A*02:01 molecules on the surface of T2 cells when incubated with the indicated molarity of VP11/12 peptide. Broken lines represent low affinity peptide binders as determined by low levels of HLA-A*02:01 molecules stabilized on the surface of T2 cells. Error bars show standard deviation (SD) obtained from 3 independent experiments.
