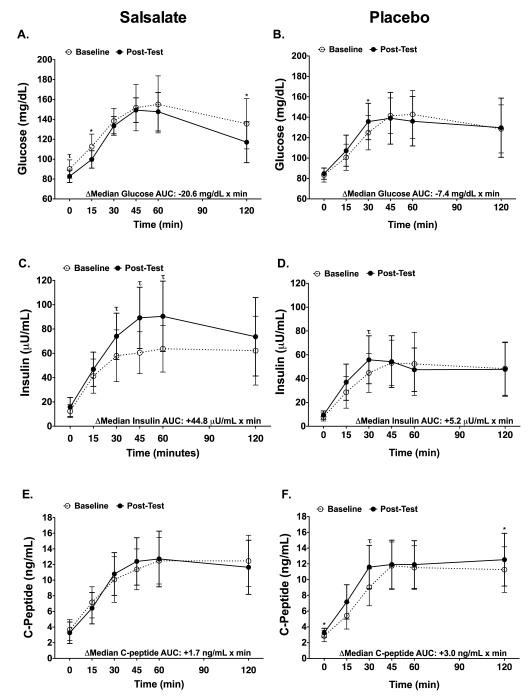
Figure 3. Glucose, Insulin, C-Peptide During the 2-hr OGTT.
Results from the 2-hour OGTT. Mean ± standard deviation for plasma glucose (A, B), insulin (C, D), and C-Peptide (E, F) responses are shown for salsalate (left column) and placebo (right column). White circles and dashed lines = baseline. Back circles and solid lines = post-test. ΔMedian is equal to the difference between post-test and baseline AUC medians. *P<0.05, τP<0.01. P-values were obtained using ANCOVA analysis (change in salsalate vs. change placebo) with adjustment for the dependent variable at baseline as well as percent body fat. A significant treatment effect was only observed for insulin AUC (Ptreatment<0.01).

