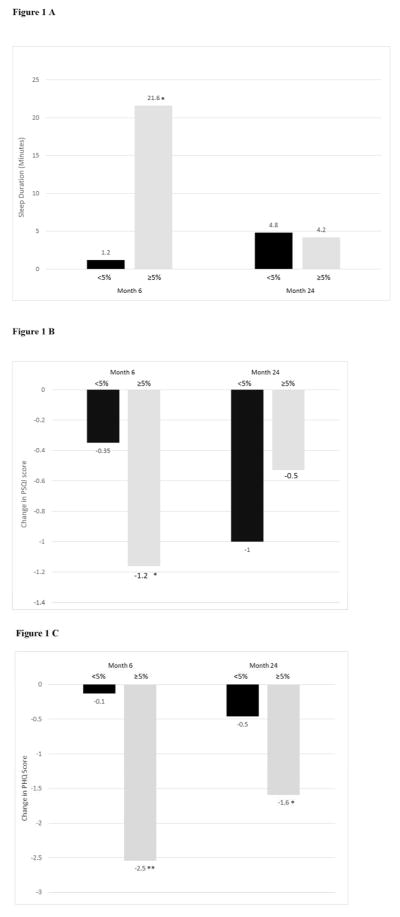
Figure 1.
Figure 1 A: Changes in sleep duration (minutes) at months 6 and 24 based on losing <5% of initial weight (Ns = 202 and 178, respectively) vs ≥5% (Ns = 113 and 87, respectively). *Significant difference between groups, p <0.05.
Figure 1 B: Changes in sleep quality (measured by the PSQI) at months 6 and 24 based on losing <5% of initial weight (Ns =200 and 179, respectively) vs ≥5% (Ns = 116 and 87, respectively). *Significant difference between groups, p<0.05.
Figure 1 C: Changes in mood (measured by the PHQ-8) at months 6 and 24 based on losing <5% of initial weight (Ns = 209 and 187, respectively) vs ≥5% (Ns =115 and 93, respectively). *Significant p<0.05; ** Significant difference between groups, p<0.0001.

