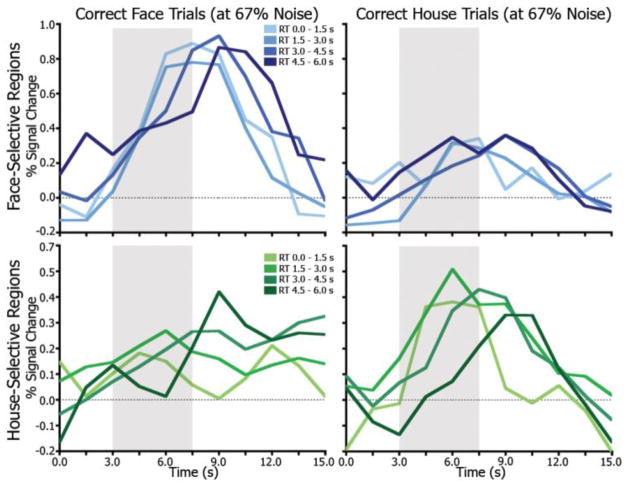
Figure 4.
Accumulation effects at a single noise level. Average time series from all face-selective regions separated by time of RT for trials at 67% noise only. Lighter colors indicate earlier RTs. The grey box highlights the leading edge of the time series, illustrating the differential rates of accumulation leading up to decision time.

