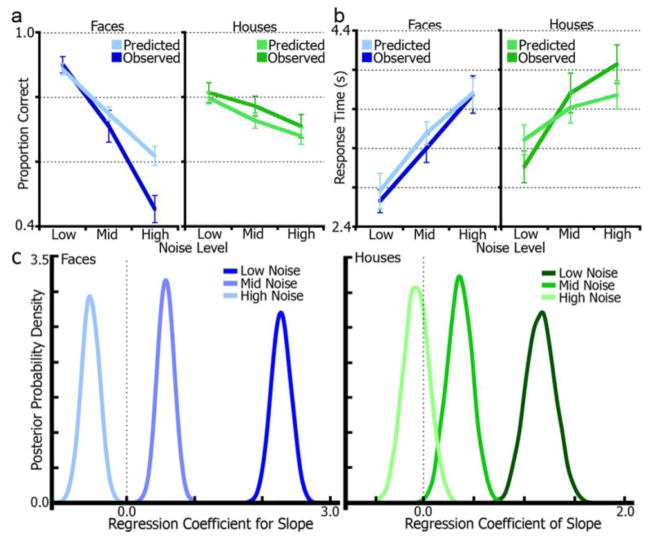
Figure 6.
Drift-diffusion model regression of fMRI accumulation measures. (a), Model-predicted (simulated) accuracy data generated from single-subject model posterior distributions plotted with empirical (observed) accuracy data for stimulus and noise-level conditions. (b), model-predicted RT data is plotted with empirical RT data. (c), posterior densities from a diffusion model regression of fMRI accumulation slope and drift-rate by noise-level and stimulus. Distributions that are more than 95% to the left or right of zero signify significant effects. All conditions except high-noise faces displayed a significant effect. Distribution peaks signify the most likely regression coefficient values. Positive regression coefficients correspond to a positive correlation whereas negative coefficients reflect anti-correlations.

