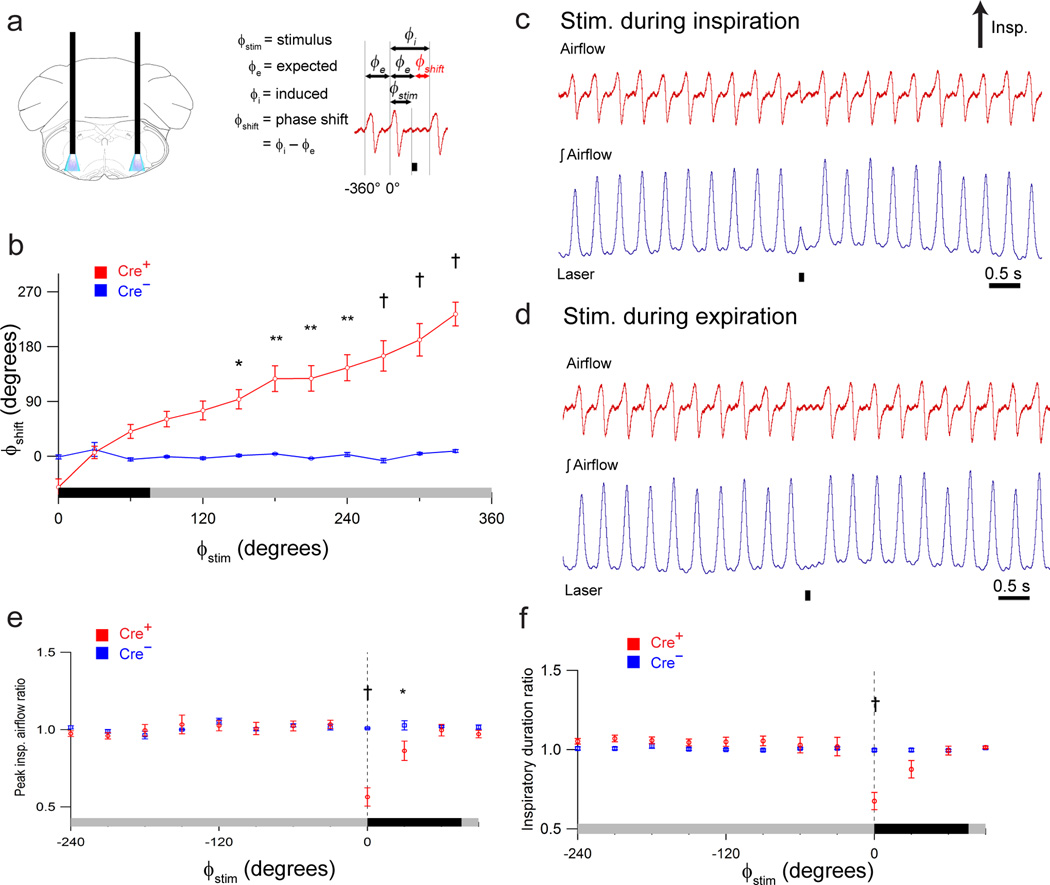
Figure 2. Photostimulation of preBötC GlyT2 neurons depresses breathing.
(a) Left: Schematic depicting bilateral placement of optical cannulae targeting preBötC. Right: schematic airflow trace depicting definitions of stimulus phase (ϕstim), expected phase (ϕe), induced phase (ϕi), and phase shift (ϕshift), demarcated with horizontal arrows, relative to the reference cycle that spans 0° – 360°; the control cycle preceding reference cycle spans phase 360° – 0°. Black bar below trace is laser-on period that defines the start of ϕstim. ϕe is the period of the previous control respiratory cycle, and ϕshift is the difference between ϕe and ϕi. (b) Shift in respiratory phase (ϕshift) resulting from bilateral photostimulation (100 ms pulse) of preBötC GlyT2 neurons in GlyT2-cre+ (Cre+, red; n = 5) and GlyT2-cre− (Cre−, blue; n = 5) mice. Stimulus phase (ϕstim) is depicted on x-axis (b, e, f) with inspiration (black bar) defined from 0° – 72°, with gray bar: (b) the subsequent expiration defined from 72° – 360° or (e, f) the preceding expiration defined from −288° – 0°. P values: 150 – 180°: P = 0.007; 180 – 210°: P = 2×10⁻⁵; 210 – 240°: P = 4×10⁻⁶; 240 – 270°: P = 4×10⁻⁷; 270 – 300°: P = 1×10⁻⁹; 300 – 330°: P = 5×10⁻¹⁰; 330 – 360°: P = 4×10⁻¹⁰. (c, d) Representative airflow and tidal volume (airflow) traces illustrating effect of photostimulation (100 ms pulse; black bar beneath trace) during inspiration (c) and expiration (d). (e, f) Comparison of ratio of peak inspiratory airflow (e; 0 – 30°: P = 4×10⁻¹⁰; 30 – 60°: P = 0.02) or inspiratory duration (f; 0 – 30°: P = 4×10⁻¹⁰) in GlyT2-cre+ (Cre+, red) and GlyT2-cre− (Cre−, blue) anesthetized mice. Dotted vertical line (e, f) at 0° indicates onset of inspiration. Error bars, mean ± s.e.m. Statistical significance was determined with a one-way ANOVA and pair-wise comparisons were made with Tukey’s HSD test. * P < 0.05; ** P < 0.001; † P < 10−8.

