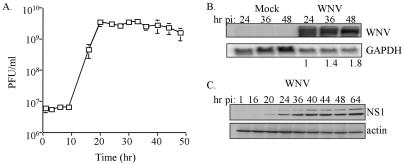
FIG. 1.
Characterization of WNV-NY replication in 293 cells. (A) Growth of WNV-NY in 293 cells. Cultures were inoculated with WNV-NY at an MOI of 5.0. Medium was removed from cultures at the indicated times and cleared of cell debris, and titers were determined by plaque assay on Vero cells. Values represent the number of PFU per milliliter of supernatant and are the results of two separate experiments. (B) Northern blot analysis of WNV-NY-infected 293 cells. The hours postinfection (hr pi) for mock- or WNV-infected cells are indicated above each lane. WNV genomic RNA was detected by using a 32P-labeled probe encoding the WNV NS2A sequence. As a control, the same blot was stripped and reprobed with labeled DNA complementary to GAPDH. Bands were quantified by phosphorimager analysis. The values shown below the samples from WNV-infected cells indicate the abundance of viral RNA detected at 36 and 48 h postinfection relative to the level of viral RNA at 24 h postinfection. The elevated levels of GAPDH expression detected at 36 and 48 h posttreatment in mock-infected cells was due to the overloading of these lanes and does not reflect differences in RNA metabolism. Importantly, the level of GAPDH detected in WNV-NY-infected cultures was similar for all time points examined. (C) Kinetics of expression of the WNV NS1 protein in 293 cells. Extracts, prepared from WNV-NY-infected 293 cells that were harvested at the indicated time points postinfection, were subjected to immunoblot analysis for WNV NS1 and actin expression. The observed doublet is attributed to differential N-linked glycosylation (2).

