Fig. 1.

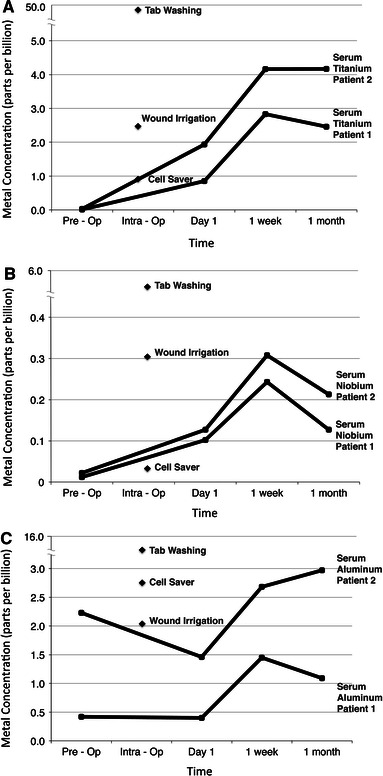
Titanium, niobium and aluminium levels from local and systemic fluid samples taken at various time intervals (Fig. 1a, b, c, respectively). Cell saver and wound irrigation data labels represent mean values (n = 2)

Titanium, niobium and aluminium levels from local and systemic fluid samples taken at various time intervals (Fig. 1a, b, c, respectively). Cell saver and wound irrigation data labels represent mean values (n = 2)