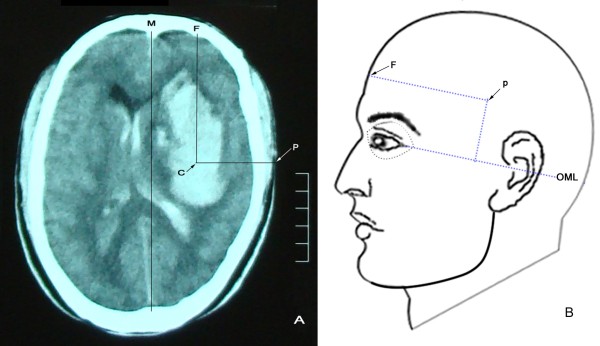
Figure 1.

Brain CT scan slice with the maximum hematoma area above the outer canthus-meatus line (OML) with the puncture point shown. A: brain CT. Extension lines from the center (C) of the hematoma vertically and horizontally outward to the frontal (F) scalp and temporal puncture (P) point are represented by CF and CP, respectively. Here, CF is parallel to the median sagittal line (M), and CP is perpendicular to CF. P is the puncture point. Puncture depth is the distance between C and P. B: a diagram of the puncture point on the body surface. Here, the distance from F to P is equal to the CF line and parallel to the OML. The vertical length from the OML to P on the body surface is equal to the height (mm) from the OML to the maximum hematoma slice on the CT film.
