. 2015 Feb 18;13:22. doi: 10.1186/s12955-015-0218-4
© Furber and Segal; licensee BioMed Central. 2015
This is an Open Access article distributed under the terms of the Creative Commons Attribution License (http://creativecommons.org/licenses/by/4.0), which permits unrestricted use, distribution, and reproduction in any medium, provided the original work is properly credited. The Creative Commons Public Domain Dedication waiver (http://creativecommons.org/publicdomain/zero/1.0/) applies to the data made available in this article, unless otherwise stated.
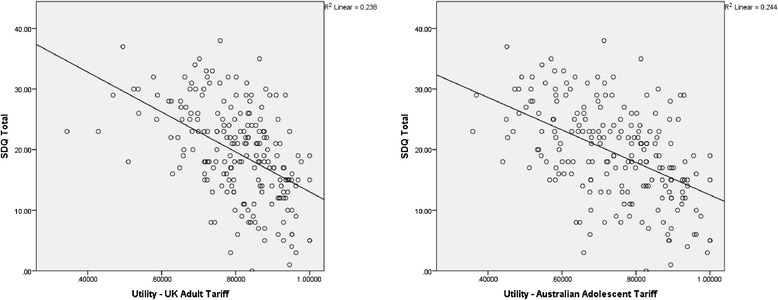
Figure 2.

Scatterplot of CHU9D utility weights and SDQ scores by Tariff.
