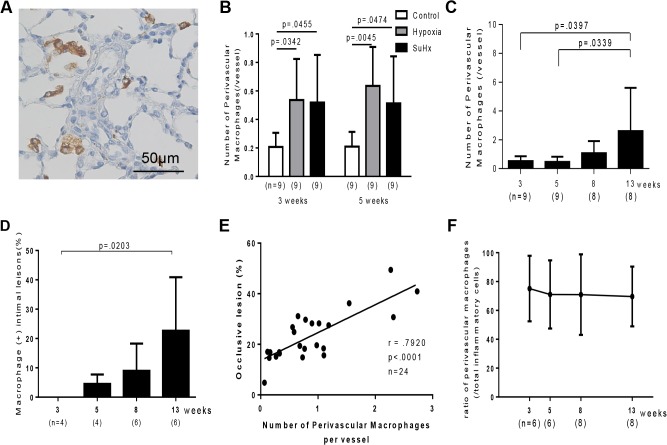
Fig 7. Inflammatory cells in Sugen/hypoxia rats.
A: Photomicrographs of CD68-positive macrophages and pulmonary vascular lesions in a Sugen/hypoxia rat 3 weeks after initial treatment. B: Number of perivascular CD68-positive macrophages per vessel in control, hypoxia, and Sugen/hypoxia groups at 3 and 5 weeks was compared with a one-way analysis of variance followed by Tukey-Kramer multiple comparison test. Number of perivascular CD68-positive macrophages per vessel (C) and the percentage of macrophage-positive intima (D) at different time points were compared with a one-way analysis of variance followed by Tukey-Kramer multiple comparison test. Values are mean ± SD. E: Positive correlation between the number of perivascular macrophages per vessel in a lung section and the percentage of occlusive lesions in a lung section (Pearson product-moment correlation coefficients). F: Percentage of the number of perivascular macrophages per vessel in that of total perivascular inflammatory cells, including macrophages, CD3+ T cells, and mast cells, at different time points were compared with a one-way analysis of variance followed by Tukey-Kramer multiple comparison test.

