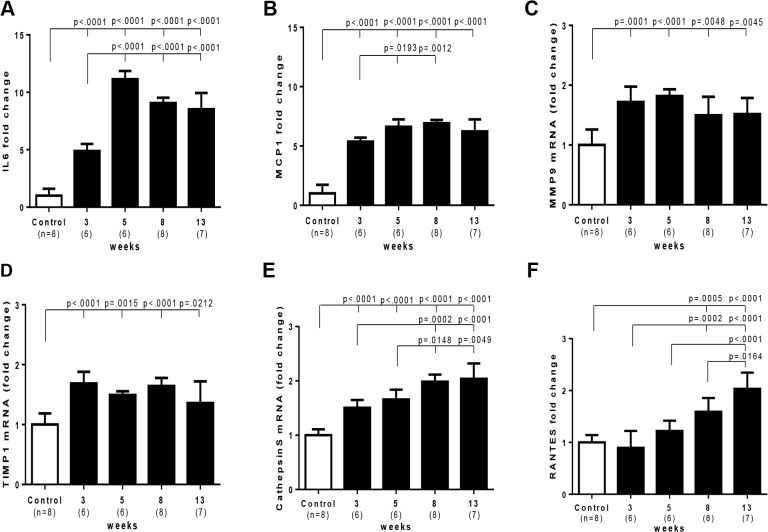
Fig 8. Time course of PAH-related inflammatory gene expression in Sugen/hypoxia rats.
Messenger RNA level of various genes at different time points and in controls was compared with a one-way analysis of variance followed by Tukey-Kramer multiple comparison test. Open square (control) indicates the control group 3 weeks after the vehicle treatment; closed square indicates Sugen/hypoxia rats at respective time points. IL6, interleukin 6; MCP1, monocyte chemotactic protein 1; MMP9, matrix metalloproteinase 9; TIMP1, tissue inhibitor of metalloproteinase 1; RANTES, Regulated on Activation, Normal T Cell Expressed and Secreted. Data are expressed as fold-change compared with the control group. Values are mean ± SD.

