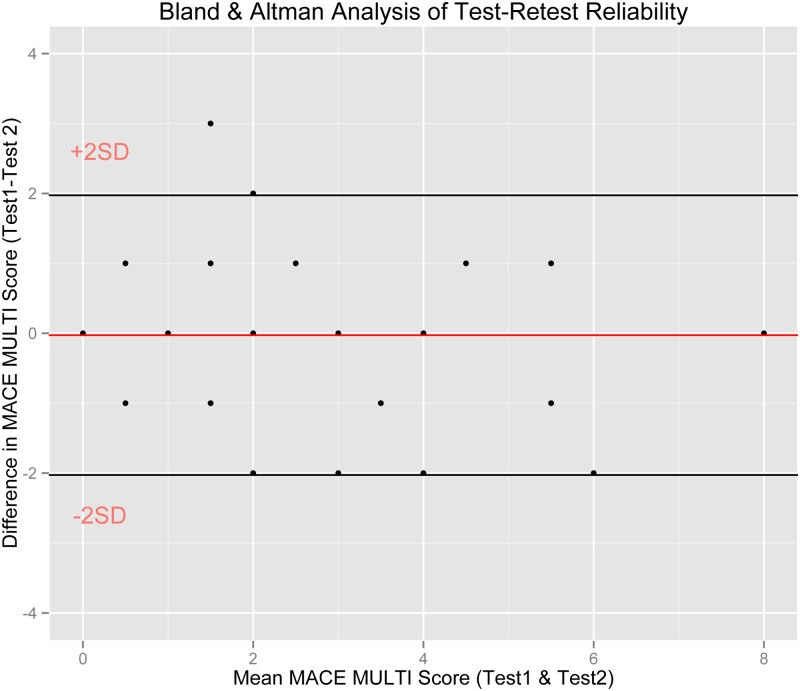
Fig 3. Test-retest Reliability.
Bland and Altman analysis of reliability / reproducibility of test—retest scores. Red line indicates the mean difference between test and retest scores, which is close to zero. Horizontal lines indicate confidence intervals showing that test-retest difference scores fall within ± 2 points.

