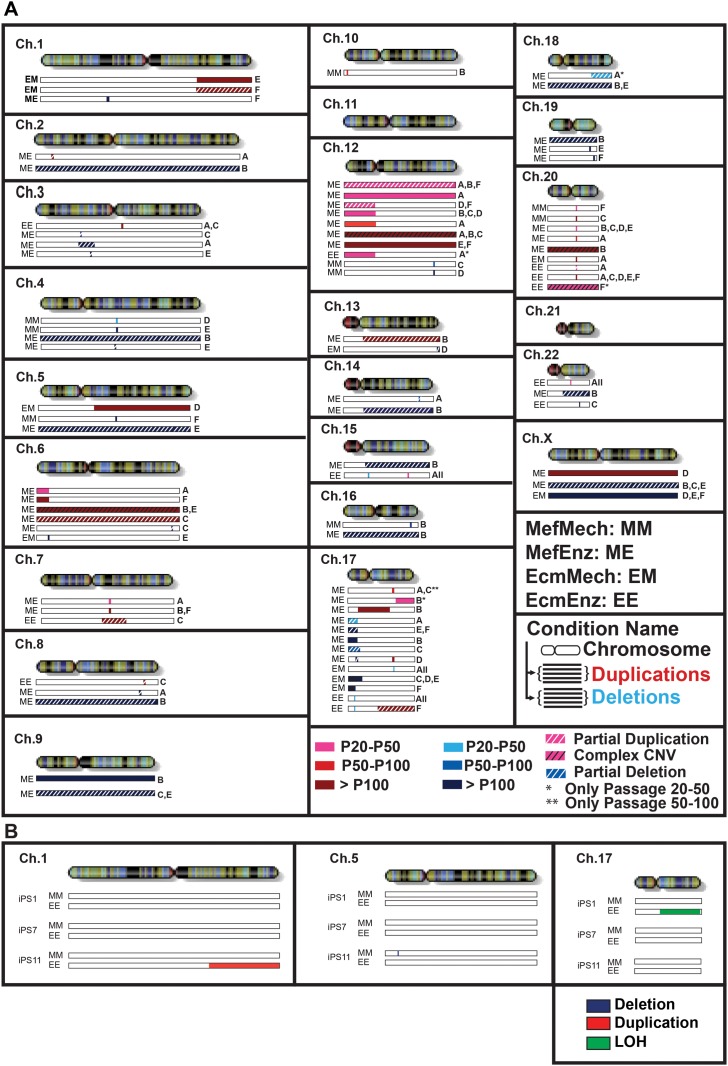
Fig 3. Overview of genetic aberrations.
Results are shown for the WA09 hESC line (A) and the HDF51IPS1, HDF51IPS7, and HDF51IPS11 hiPSC lines (B). Fig. 3A shows regions of duplication and deletion in the 4culture conditions for the WA09 hESC line. Duplications (3 or 4 copies) (identified by CNVPartition 3.2.0) are shown below the chromosome in a red scale. Deletions (0 or 1 copy) (identified by CNVPartition 3.2.0 and replicate error analysis) are shown below the regions of duplication in a blue scale. Red and blue scales are used to represent the passage when the event (duplication or deletion) first occurred, and they range from light colors (early passages) to darker colors (late passages). White and black hatches represent partial mutations (duplications or deletions that are present in only a subpopulation of cells) and complex CNVs (CNVs that appear to be composed of both duplicated and deleted regions, for which the precise copy numbers cannot confidently be called based on the SNP genotyping data), respectively. Asterisks represent mutations that were present only in earlier passages and were not detectable in later passages. For each CNV in each condition, the replicate(s) in which the event was detected is indicated by a letter to the right of each bar. Fig. 3B shows regions of duplication, deletion and LOH in the 2 culture conditions for the hiPSC lines. Duplications are shown in blue, deletions are shown in red and regions of LOH are shown in green. The chromosome ideograms are from http://genomics.energy.gov.

