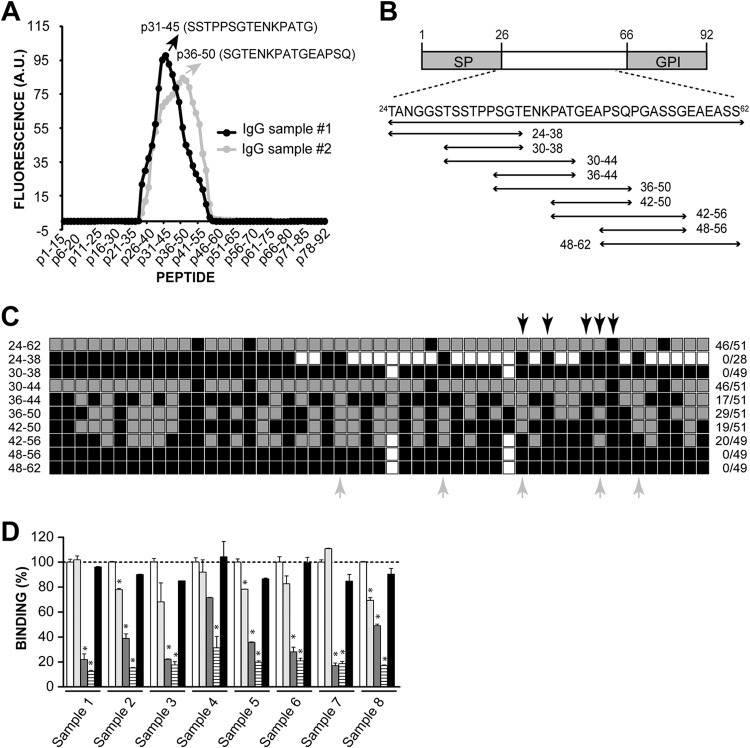
FIG 1.
Mapping of antigenic sequences in TSSA-CL. (A) Peptide chips composed of 15mer peptides overlapping by 14 residues spanning the complete sequence of TSSA-CL were probed, in duplicate, with 2 different IgG samples purified from chronic Chagasic sera. The mean reactivity toward every TSSA-CL-derived peptide (in arbitrary units [A.U.] of fluorescence) and the sequence of the peptide showing the highest reactivity for each IgG sample are indicated. (B) Schematic illustration of TSSA-CL showing the predicted signal peptide (SP) and the GPI-anchoring signal (GPI). The sequences derived from TSSA-CL that were expressed as GST-fusion molecules and the residues spanned by each construct (numbers indicate amino acid positions in each sequence relative to the initial Met) are indicated at the bottom. (C) Schematic diagram showing the anti-TSSA-CL reactivity profile obtained for each sample. Individual serum samples from chronic Chagasic patients (n = 51) were tested toward TSSA-CL deletion variants by ELISA. The gray square boxes indicate positive reactivity, and the black square boxes indicate negative reactivity. The white square boxes indicate nontested molecules. The fraction of positive serum samples/total assayed serum samples is indicated to the right. The identity of pooled sera used to purify IgG sample 1 and IgG sample 2 (see panel A) are indicated by black and gray arrows, respectively. (D) Competitive ELISAs. Eight individual serum samples from chronic Chagasic patients not tested in panel C were preincubated with 2 μg of p36-50 (light gray columns), p30-44 (dark gray columns), p30-50 (striped columns), or a scrambled version of p30-50 (black columns) for 30 min and then added to GST-TSSA24-62-coated ELISA plates. Absorbance of a control sample preincubated with PBS (white columns) was taken as 100% binding. *, significant differences between the population means (P < 0.001 after Bonferroni's correction).

