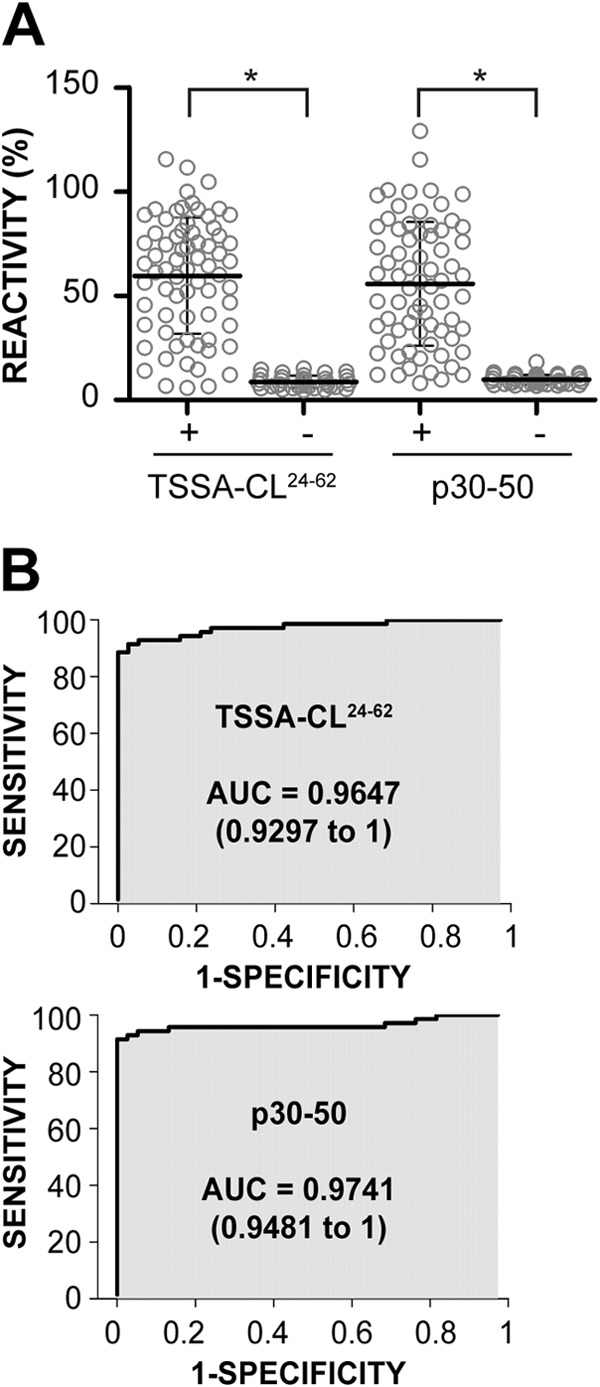
FIG 2.

Receiver operating characteristic (ROC) curve analysis of the ELISA results using TSSA-CL-derived reagents. (A) Dot plot analysis of ELISA results using a GST-fusion protein spanning residues 24 to 62 of TSSA-CL (TSSA-CL24-62) and a synthetic peptide spanning residues 30 to 50 from the same molecule (p30-50). The ELISA plates were coated with the indicated antigen and incubated with 70 serum samples from chronic Chagas-positive individuals (+) or 38 noninfected individuals (−). The mean ± SD for each group is indicated. *, significant differences between the population means (P < 0.001 after Bonferroni's correction). (B) Reactivity values in panel A were used to generate ROC curves; the area under the ROC curve (AUC) is indicated for each antigen. The values in parentheses indicate the 95% confidence intervals.
