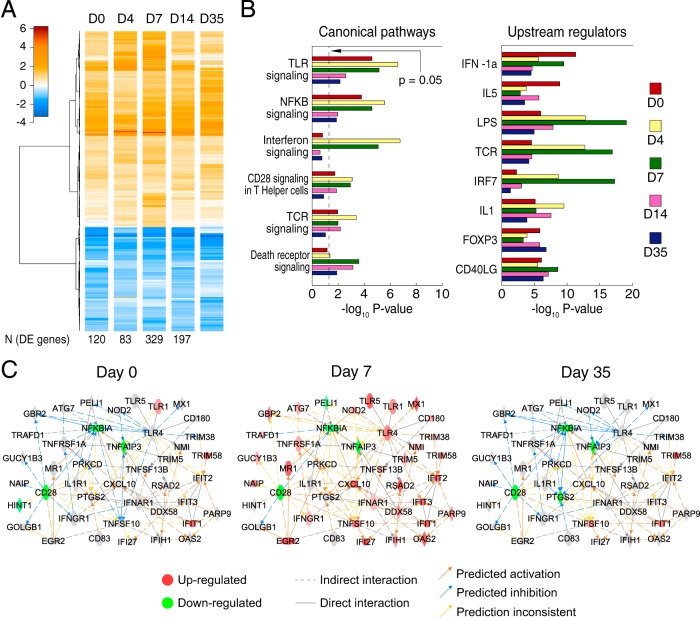
FIG 1.
Host response to immunization and Zaire Ebola virus challenge in the protected group. (A) Heatmap showing, at each time point, the average log2 fold change (FC) compared to D−28 of the 502 pooled DE genes from D0 to D35. The differential expression observed at D0 tended to persist throughout the time series, although the number of genes passing the significance threshold varied, peaking at D7. (B) Functional enrichment analysis for canonical pathways and targets of upstream regulators. Both analyses show the activation of interferon responses during the first time points and T-cell activation peaking at D7. LPS, lipopolysaccharide; TCR, T-cell receptor. (C) Constructed network showing interactions between key genes from enriched canonical pathways. The D0 network showed differential expression, suggesting the regulation of immune responses, while the D7 network showed predominantly immune activation. By D35, the network had returned to near that of the D0 state.

