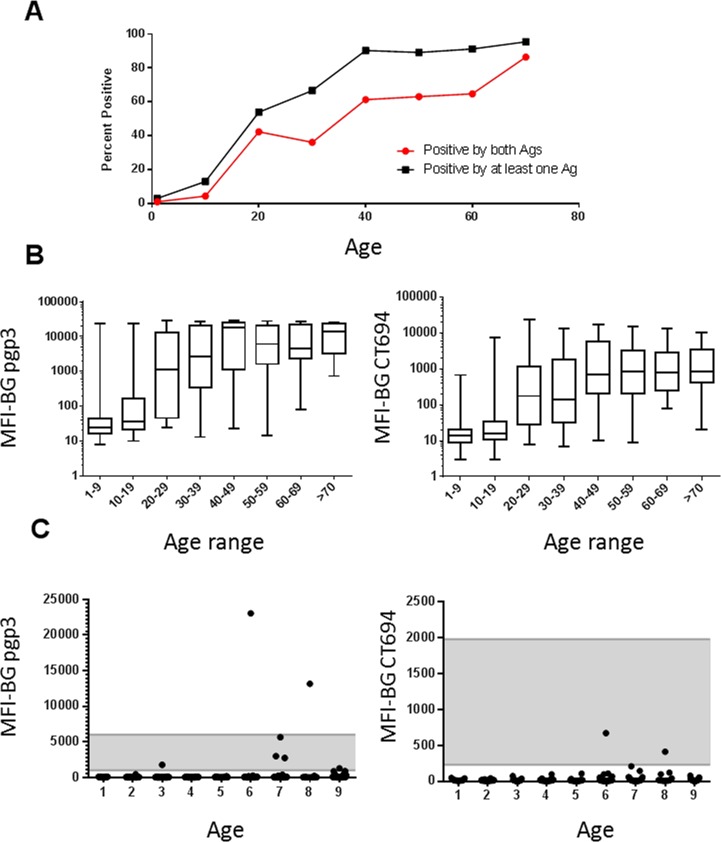
Fig 1. Antibody responses to Ct antigens 10 years after MDA cessation.
A. Age-prevalence curves for antibody responses grouped by decade. Black squares represent individuals with any antibody-positive test (to pgp3 alone, CT694 alone, or both antigens), and red squares represent responses positive to both pgp3 and CT694. B. Plots show box-and-whiskers graph (min-max) of MFI-BG against age ranges grouped by decade for antibodies against pgp3 (left) and CT694 (right). C. Plots show age against MFI-BG for children aged 1–9. Each dot represents a single individual. Note the differences in the y-axis scales for pgp3 (left) and CT694 (right). Indeterminate range is shaded. Horizontal lines indicate cutoffs for antibody positivity. Ag = antigen.

