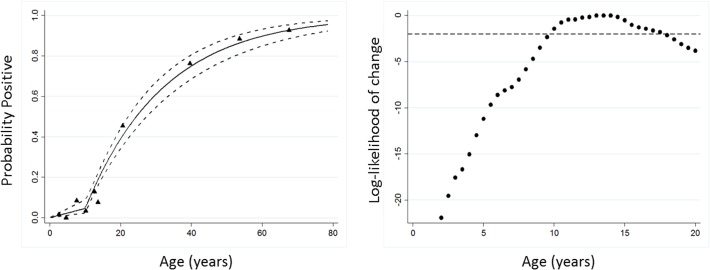
Fig 2. Force of infection modelling of seroconversion rates before and after MDA.
A. Maximum likelihood fits from reversible catalytic equilibrium model for antibody responses either pgp3 or CT694 is shown. X-axis represents the time in years that each model has a change point. The y-axis is the log-likelihoods from each model where log-likelihoods are rescaled against a maximum of 0 and a log-likelihood above -2 is an approximate 95% confidence interval when the change occurred. B. A model in which SCR changed 10 years previously, to represent the time at which MDA ceased, had a better fit than the model that assumed the SCR had remained constant (likelihood ratio test X2 = 45.4 p,0.0001). The triangles represent deciles of observed seroprevalence; the solid blue line represents the predicted values based on the model with dotted lines and the 95% CI.

