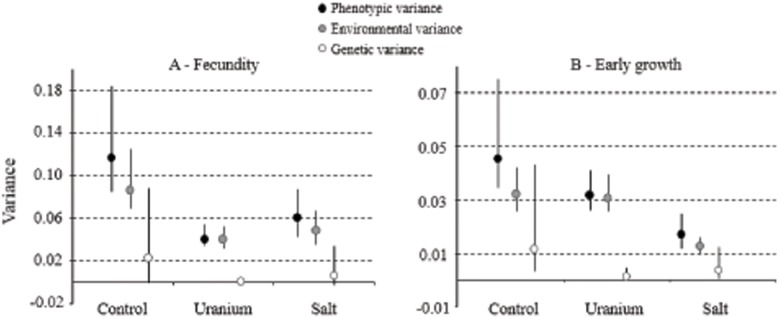
Fig 1. Trait variance estimates for C. elegans in the different environments.

Variances are presented with their 95% intervals of Bayesian credibility. (A) fecundity and (B) early growth. Phenotypic variance (V P) is split into environmental (V E) and genetic variances (V G). Estimates were obtained using multivariate models for different traits within the same environment.
