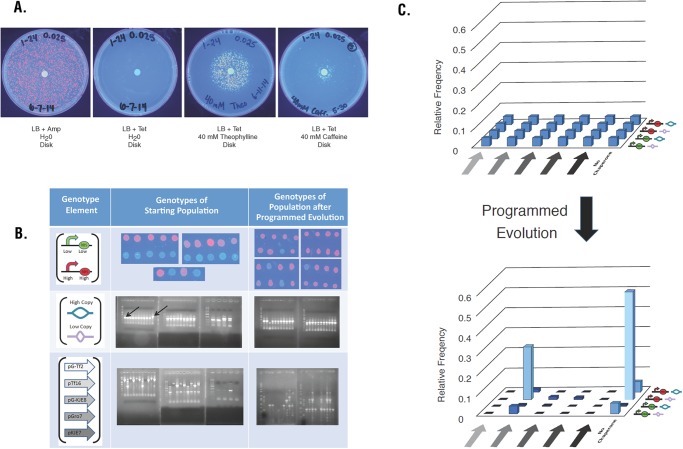
Fig 7. Results of Programmed Evolution.
(A) The starting population with equal amounts of all 24 strains was spread on LB agar plates with the indicated antibiotic and a disk treated as indicated. (B) Top row: spots of cells on LB agar with ampicillin for all 24 starting strains (left) and examples of clones after Programmed Evolution (right). Middle row: Agarose gels with PCR products to determine PCN for all 24 strains (left) and examples after Programmed Evolution (right). The 750 bp band for the low copy origin and the 500 bp band for the high copy origin are indicated by arrows. Bottom row: Agarose gels with PCR products to chaperone genotype for all 24 strains (left) and examples after Programmed Evolution (right). (C) The graph shows relative frequency of each of the genotype before (top) and after (bottom) Programmed Evolution. The order of chaperone plasmids along the left to right horizontal axis is pG-Tf2, pTf16, pG-KJE8, pGro7, pKJE7, and no chaperone. The order of genotype combinations along the other horizontal axis from back to front is high strength promoter/RBS + high copy origin; high strength promoter/RBS + low copy origin; low strength promoter/RBS + high copy origin; and low strength promoter/RBS + low copy origin.

