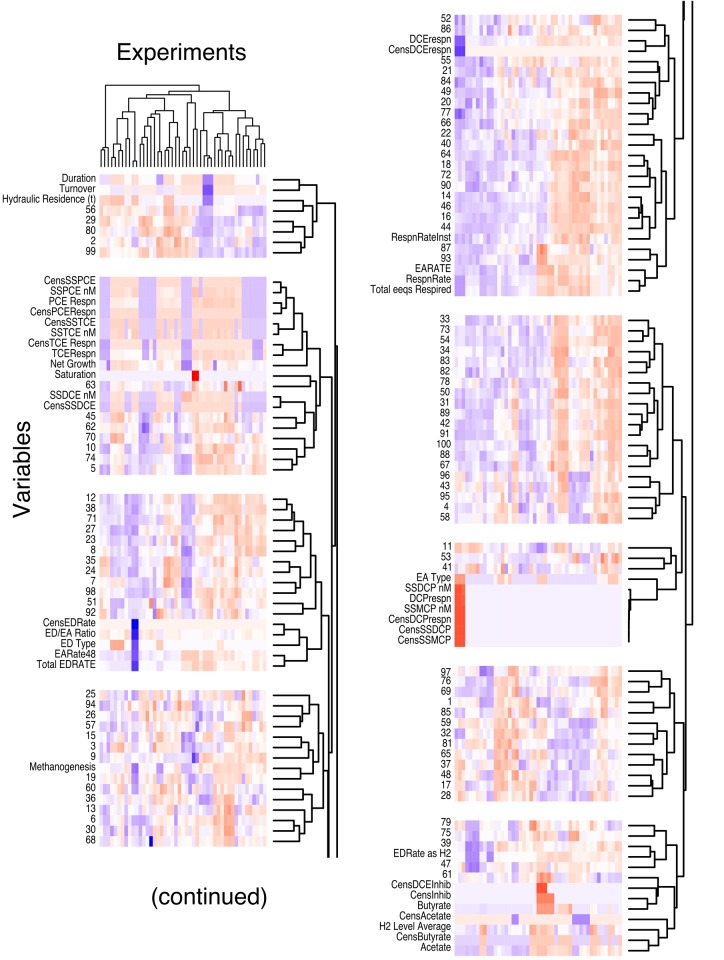
Fig 1. Heatmap constructed for the 100 eigengenes of the clusters and the 42 experimental variables recorded for Dhc across 47 experiments with varying conditions.
The heatmap is organized by the hierarchal clustering of both the variables (y-axis) and experiments (x-axis). Blue, white, and red indicate a negative, neutral, or positive microarray expression ratio (or low, mid, or high values for experimental variables), respectively. The variables are segregated into distinct blocks by introducing a white space between groups of variables that had distances greater than 0.9 × (maximum hierarchical distance).

