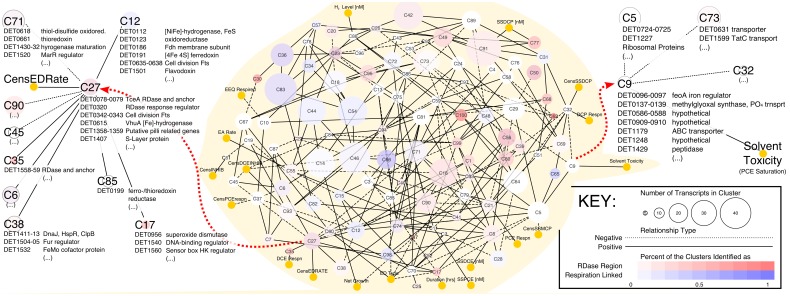
Fig 2. The SPINE (SParse eIgengene Network) inferred for the Dhc transcriptomic data (center gray area).
Experimental variables are represented as yellow nodes with a consistent size. The size of a transcript cluster node is a function of the number of transcripts in that cluster, and these transcript cluster nodes are colored as either white to red or white to blue. The nodes are colored based on the proportion of their constituent transcripts that are RDase-related (with white and red indicating a lower and higher proportion, respectively) or the proportion of their constituent transcripts identified as other oxidoreductases putatively involved in electron transport (with white and blue indicating a lower and higher proportion, respectively). Both filters are considered simultaneously, allowing purple nodes. The network was visualized in Cytoscape v. 3.0. Red arrows highlight a zoomed in neighborhood view of two clusters that are discussed in the text: (left) members of and neighbors to the C27 eigengene, the cluster containing the most highly-expressed RDase tceA (DET0079); and (right) members of and neighbors to the C9 eigengene, the only cluster connected to the solvent toxicity (saturation) experimental condition in the model.

