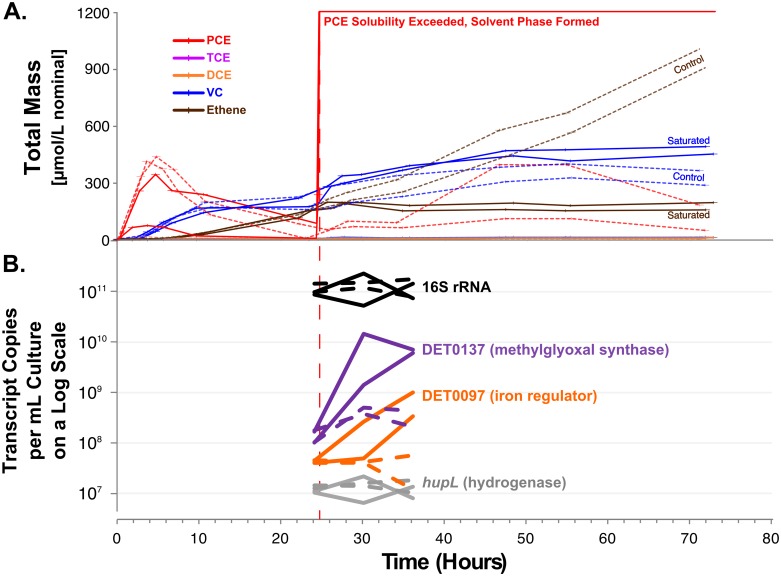
Fig 3. The response of selected Dhc strain 195 transcripts to solvent toxicity.
(a) A line plot of the concentrations of PCE, TCE, DCE, VC, and ETH during the continuously fed experiment for the saturated (solid lines) and control (dashed lines) cultures. The biological duplicates are presented individually. Excess PCE was spiked into the experimental cultures at 24 hours. TCE and DCE levels were always below 5 µmol/L. (b) A line-plot of the transcript copies per mL of culture presented on a log scale for DET0097 (a putative regulator), DET0110 (hup hydrogenase large subunit), DET0137 (a putative methylglyoxal synthase), and 16S rRNA. Data for the saturated and control cultures are represented by solid and dashed lines, respectively.

