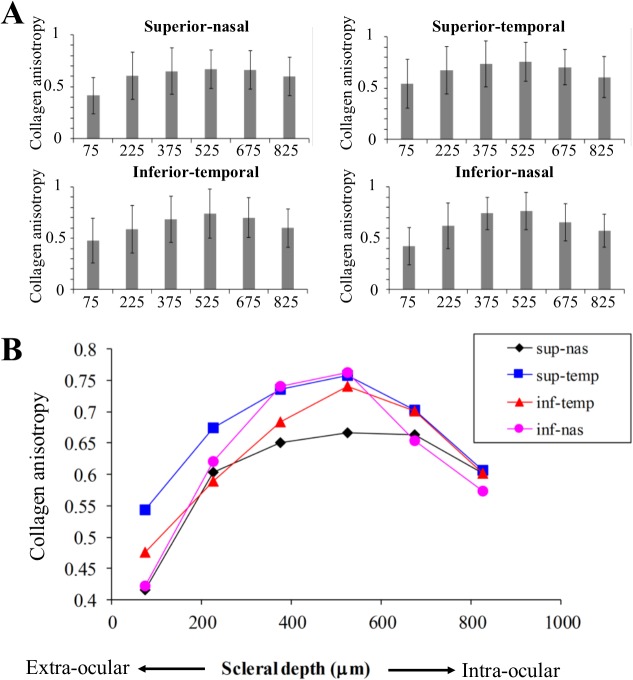
Fig 6. Anisotropy depth-profiles.
Mean collagen anisotropy vs depth (mid-section), by peripapillary region, averaged over eight human scleras. A) Bar charts to show trend in separate regions, where bar height represents mean and error bars denote standard deviation. B) Composite graph showing trend in mean for all regions.

