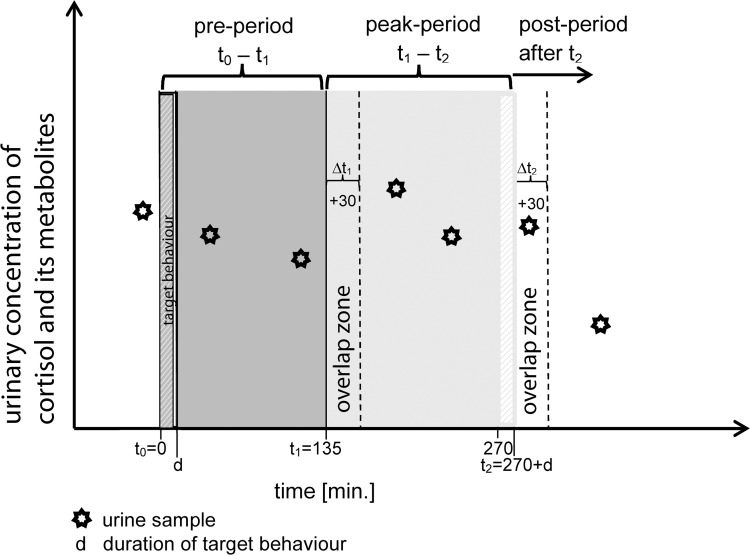
Fig 1. Visual concept of how we classified the different urine samples to the different time periods.
The time line is marked in relation to the start of the target behaviour. Point t1 refers to 135 min after the onset of the target behavior; point t2 refers to 270 min after the end of the target behaviour. The overlap zones correspond to 30 min after t1 and t2 respectively.

