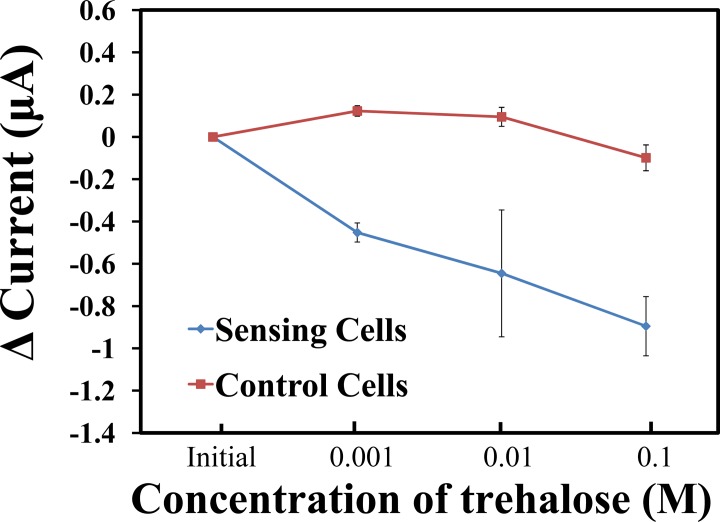
Fig 4. EG-ISFET biosensor response currents of cells reacting to trehalose.
The change of current determined with the EG-ISFET sensor is represented as a function of trehalose concentration. The sensing cells depicted as closed red squares, whereas the control cells are shown as closed blue circles.

