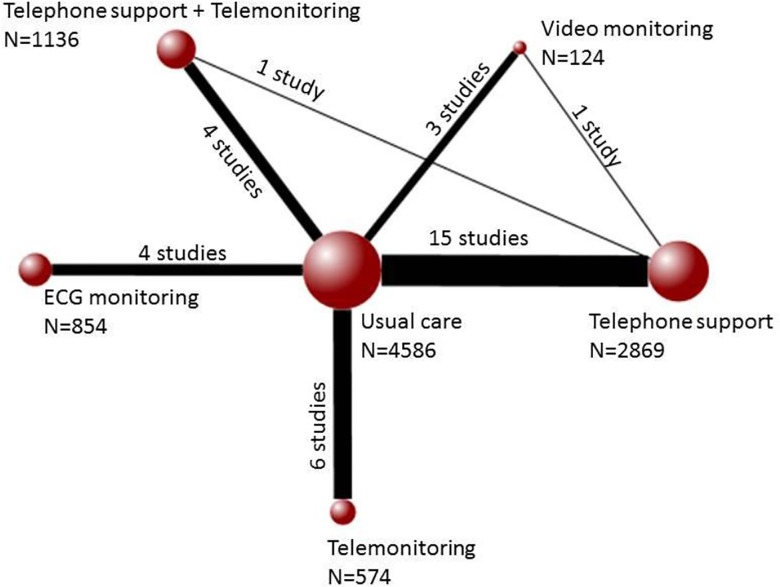
Fig 2. Evidence network for interventions included in the analysis of all-cause mortality.
Each node represents an intervention and the size of each node indicates how many patients received it of the total number of patients included in the network (N = 10,193). The solid lines connecting the nodes together indicate the existence of this comparison of interventions in the literature. The thickness of the lines represents how many studies of the total number of studies (30 studies) include a particular comparison.

