
Fig 3. The impact of different forms of telemedicine on the outcome of all-cause mortality.
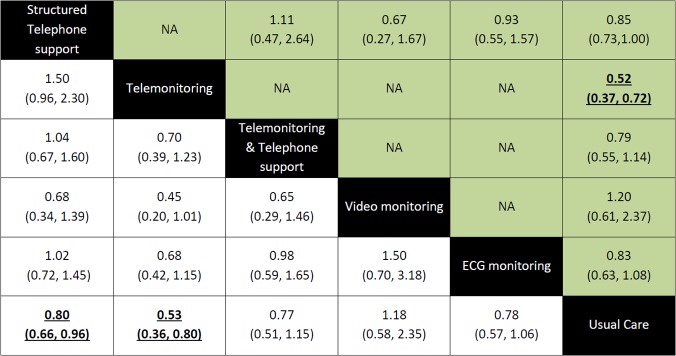
Effect estimates from the network meta-analysis occupy the bottom left part of the diagram, the estimates from the pairwise meta-analyes occupy the top right part of the diagram and the diagonal corresponds to the comparison. The odds ratios and 95% Credible Intervals for the comparisons in this diagram should be read from left to right (e.g. Patients receiving structured telephone support had a 0.80 [0.66, 0.96] reduced odds of death compared to those receiving usual care). Significant results are underlined and in bold.