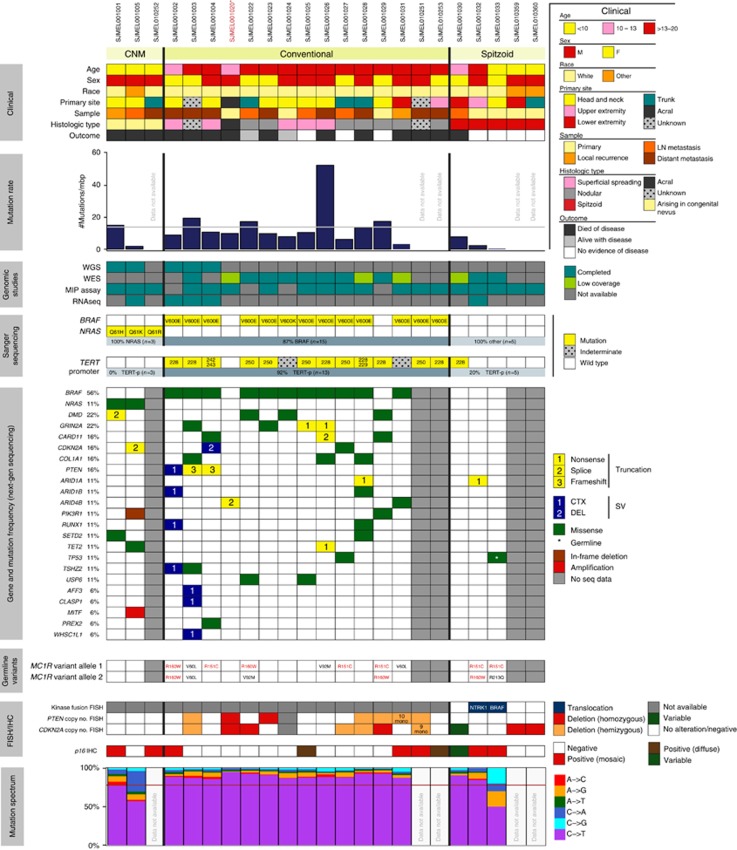
Figure 1.
The clinical and genomic data for 23 pediatric melanomas analyzed by whole genome, whole exome, and/or the molecular inversion probe assay. The mutation rate plot displays the mutation rates in the coding regions for the three subtypes of pediatric melanoma. The gray horizontal line shows the median coding mutation rate in cutaneous melanoma in adults. The mutation spectrum plot in pediatric melanoma demonstrates a high rate of cytidine to thymidine (C–>T) or guanine to adenine (G–>A) transitions in each conventional melanoma sample. The red horizontal line depicts the median rate of transition mutations in melanoma in adults (adapted from data in Hodis et al., 2012). The MC1R variants shown in red font are associated with complete loss of gene function; the variants shown in black font are associated with partial loss of gene function. * SJMEL001020 denoted with an asterisk is an acral melanoma. CTX, translocation; DEL, deletion; MIP, molecular inversion probe assay; SV, structural variation; WES, whole exome sequencing; WGS, whole genome sequencing.

