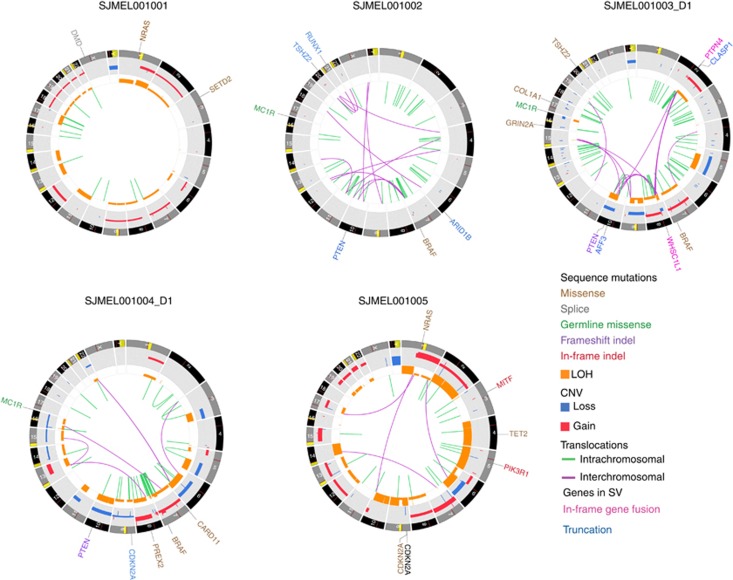
Figure 2.
Circos plots showing somatic mutation landscape for the five whole genome sequenced samples. Because of the large number of mutations, only cancer-related genes are labeled in the figure. Inner circle shows interchromosomal (purple) and intrachromosomal (green) translocations. Inner track (orange) denotes area of LOH (loss of heterozygosity). Gray track denotes somatic copy number variations (CNVs) (red=gain; blue=loss). Genes affected by point mutations (single-nucleotide variations (SNVs) and indels) and copy number changes are shown in the outer ring with colors denoting the type of mutation. Truncations and fusion genes caused by translocations are denoted by blue and pink color, respectively. All somatic variants have been validated by targeted deep sequencing.

