
Fig. 3.
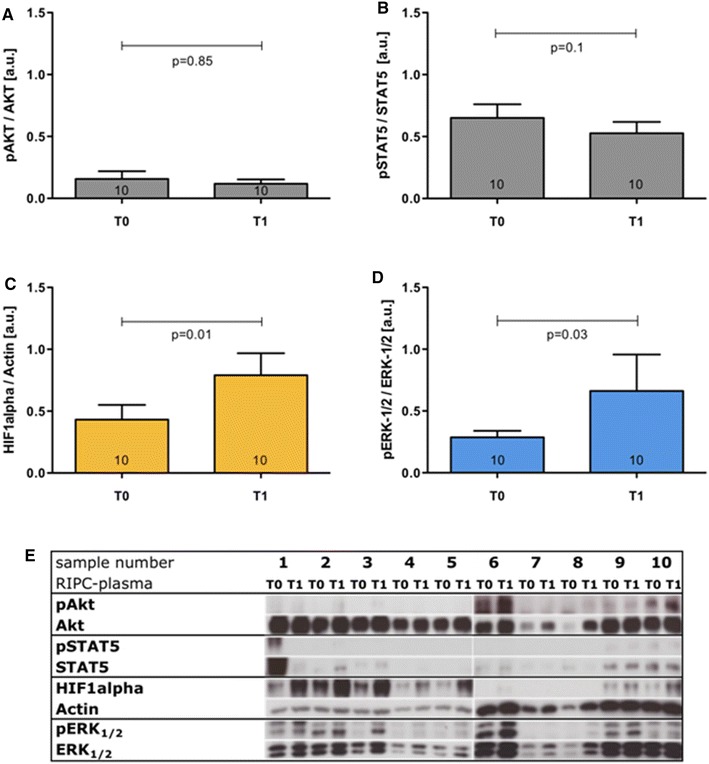
Effects of RIPC-plasma on protein expression and phosphorylation in HUVEC cells exposed to hypoxia. a Phosphorylation of AKT; b phosphorylation of STAT5; c expression of HIF1alpha; d phosphorylation of ERK-1/2. e Western blotting experiments performed with lysates of HUVEC cells that were treated with RIPC-plasma samples (#1–#10). Numbers in the columns show the numbers of different plasma samples used. Columns display the mean ± SEM