
Fig. 5.
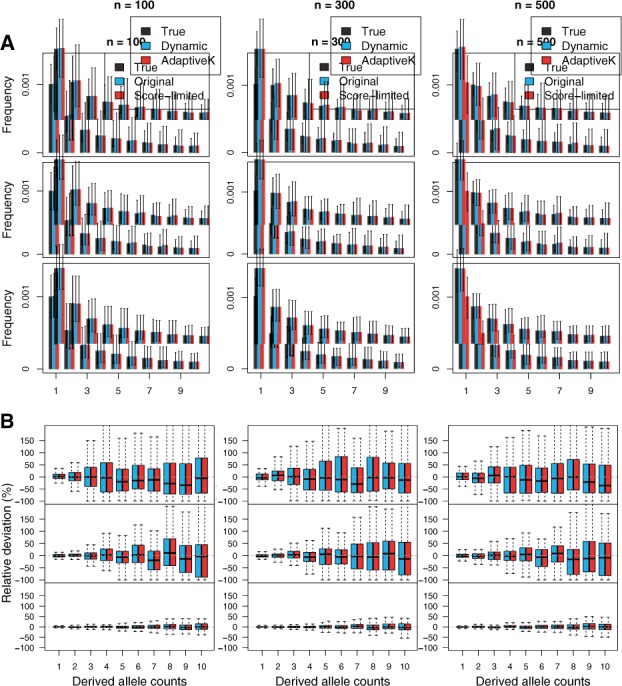
The accuracy of the inferred SFS as a function of sequencing coverage for different sample sizes. The sequencing data were simulated at coverage 3× (top), 5× (middle) and 10× (bottom) with the error rate of 0.001 and the sample size of 100, 300 and 500. (A) Shapes of the inferred SFS (shown in colors in legend) compared with the ground-truth SFS (shown in gray). (B) Relative deviation of a fraction of sites with the derived allele counts of 1–10