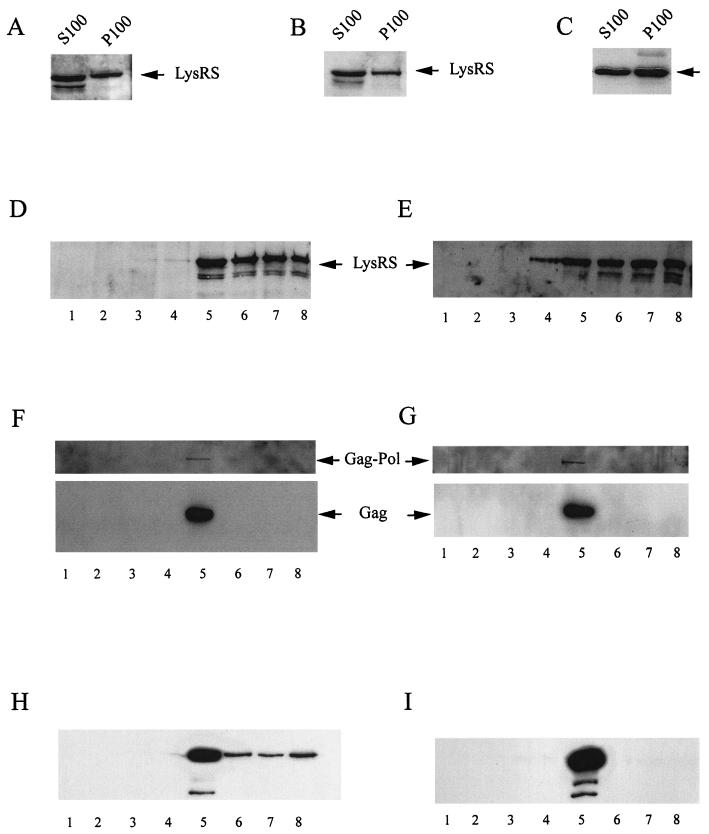
FIG. 2.
Cellular distribution of LysRS in 293FT cells lysed with Triton X-100. Uninfected and protease-negative HIV-1-transfected 293FT cells were lysed at 4°C in Triton X-100 buffer, and the postnuclear supernatants were resolved into S100 and P100. (A, and B) Western blots of the S100 and P100 from uninfected cells (A) or HIV-1-transfected cells (B) were probed with anti-LysRS. (C) Western blots of the S100 and P100 from uninfected cells were probed with anti-p38. (D and E) The P100 fractions from uninfected cells (D) and HIV-1-transfected cells (E) were resolved on iodixanol gradients, and aliquots of each gradient fraction were analyzed by Western blots probed with anti-LysRS. Denser fractions found at the bottom of the gradient are represented by larger fraction numbers. (F and G) Each iodixanol gradient fraction from HIV-1-transfected cells was immunoprecipitated with either anti-IN (F) or anti-LysRS (G), and the immunoprecipitates were analyzed by Western blots probed with anti-reverse transcriptase and anti-CA. (H and I) 293FT cells were transfected with the plasmid hGag, which expresses only Gag. Cells were lysed at 4°C in Triton X-100 buffer, and the postnuclear supernatants were resolved into S100 and P100. The P100 was resolved on an iodixanol gradient, and gradient fractions were immunoprecipitated with either anti-CA (H) or anti-LysRS (I). Western blots of the immunoprecipitates were probed with anti-CA.

