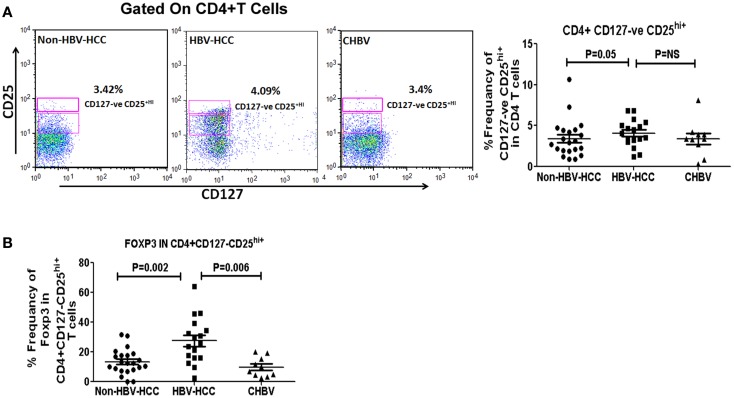
Figure 2.
(A) CD4+CD25+CD127low Tregs were analyzed using CD25 and CD127 markers on CD4+ gated population of T cells. Representative flow-cytometric dot plots and scatter plot showing the frequencies of CD4+CD25+CD127low Tregs in all three groups. (B) Scatter plot shows increased expression of FoXP3 positive CD4+CD25+CD127low Tregs in HBV-HCC than non-HBVHCC (P = 0.002).

