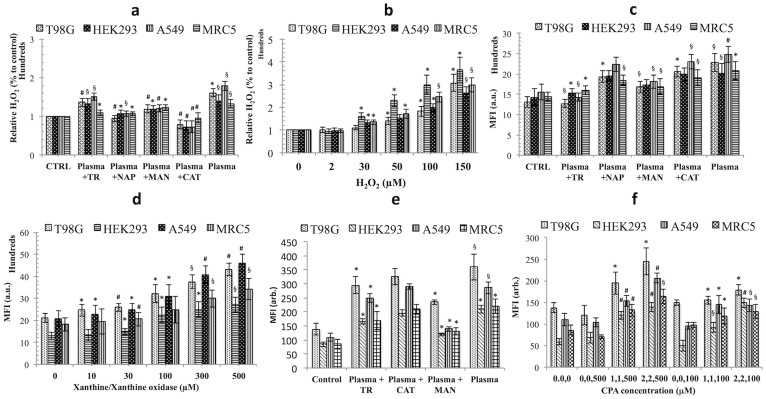
Figure 4. Detection of H2O2, O2− and HO· in plasma and chemical exposed cancer and normal cells.
(a, b) H2O2 level in cells detected with an Amplex Red fluorescent H2O2 probe in plasma and H2O2 chemical systems (c, d) O2− detection in plasma and chemical systems [xanthine/xanthine oxidase] in cancer and normal cells with a DHE fluorescent probe (1 mM), and (e, f) HO· radical detection using HPF (10 μM) in plasma and CPA [CuSO4, phenanthroline, and ascorbic acid] chemical systems by an ELISA plate reader. Results are expressed as the mean ± SD (n = 3). Student's t-test was performed to control, whereas in (a), (c) and (e) plasma plus scavenger-treated group was compared to only plasma-treated group (* p < 0.05, § p < 0.01, # p < 0.001).

