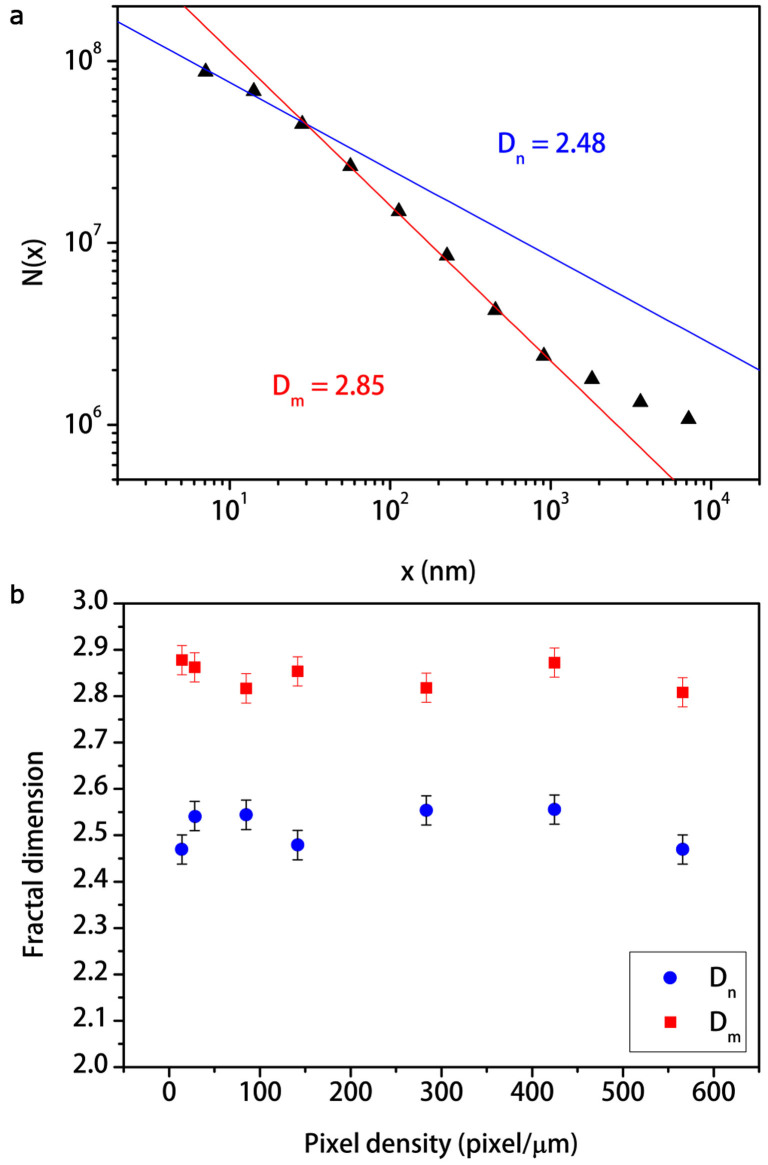
Figure 5. Fractal analysis of a SWCNT film by triangulation method.
(a), The log N(x)-log x plot exhibits two fractal dimensions Dm = 2.85 ± 0.03, Dn = 2.44 ± 0.03 with maxima  ,
,  and minima
  ,
,  fractal lengths, for the sample 1 SWCNT in Table 1. High values of the triangle size x beyond Lm value correspond to the edge of the SEM image. Therefore, the number of all triangles that contain at least one pixel of the image N(x) is close to zero returning D = 2 as dimension of the plane. (b), The graph shows that fractal dimensions Dm (red squares) and Dn (blue dots) do not change with SEM image pixel density, demonstrating thereby the scale-invariance and self-affinity properties. The estimation of the systematic error on D is the average of the semi-dispersion between the known theoretical values of the test fractals and the measured values, over all the tested fractals.

